Configuring Centralized logging with Kafka and ELK stack
Last modified: 07 Jun, 2020
Introduction
In real world, any production incident soon turns out to be scary when we have to go through hell lot of logs.
Some times it will be very difficult to replicate the issue by analyzing data is scattered across different log files. This is when Centralized Logging comes to rescue to stitch together all the logs into one place.
But this comes with a challenge if centralizing logging tool is not configured to handle Log-bursting situations. Log-bursting event causes saturation, log transmission latency and sometimes log loss which should never occurs on production systems.
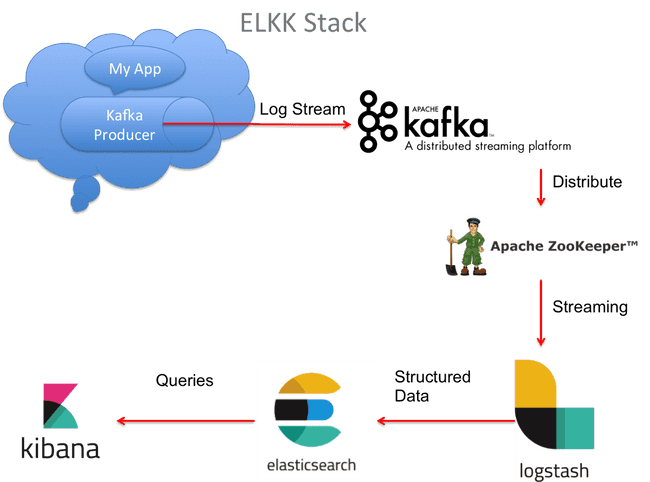
To handle such situation, we can publish logs to Kafka which acts as a buffer in front of Logstash to ensure resiliency. This is one of many best ways to deploy the ELK Stack to reduce log overload.
In this article, We shall orchestrate complete solution using docker to configure Kafka with ELK stack to enable centralized logging capabilities.
Technology stack
- Apache Kafka - Collects logs from application & queues it.
- Kafka Manager - A web-based management system for Kafka developed at Yahoo
- Logstash - aggregates the data from the Kafka topic, processes it and ships to Elasticsearch
- Elasticsearch - indexes the data.
- Kibana - for analyzing the data.
Prerequisites
Solution tried out in this article is setup and tested on Mac OS and Ubuntu OS. If you are on windows and would like to make your hands dirty with Unix, then I would recommend going through Configure development environment on Ubuntu 19.10 article which has detailed steps on setting up development environment on Ubuntu.
At the least, you should have below system requirements and tools installed to try out the application:
DockerDocker Compose- System Requirements
- Processor: 4 Core
- Memory: 6 GB RAM
- Swap: 2 GB.
- Disk image size: 100 GB
Configuring Kafka & Kafka Manager
Kafka Docker images are published by multiple authors. Below are two which are trusted by the most
For this article, we are using the image published by Spotify - spotify/kafka
Why did we choose spotify/kafka image ?
The main hurdle of running Kafka in Docker is that it depends on Zookeeper. Compared to other Kafka docker images, this image runs both Zookeeper and Kafka in the same container.
This results to:
- No dependency on an external Zookeeper host, or linking to another container
- Zookeeper and Kafka are configured to work together out of the box
For seamless orchestration, we shall bootstrap all the required containers with Docker Compose for this setup.
Below is the snapshot for configuring Kafka & Kafka Manager in docker-compose.yml
services:
  # Kafka Server & Zookeeper Docker Image
  kafkaserver:
    image: "spotify/kafka:latest"
    container_name: kafka
    # Configures docker image to run in bridge mode network
    hostname: kafkaserver
    networks:
      - kafkanet
    # Make a port available to services outside of Docker
    ports:
      - 2181:2181
      - 9092:9092
    environment:
      ADVERTISED_HOST: kafkaserver
      ADVERTISED_PORT: 9092
Kafka Manager is a tool from Yahoo for managing Apache Kafka cluster. Below is snapshot of its configuration in docker-compose.yml.
  # Kafka Manager docker image, it is a web based tool for managing Apache Kafka.
  kafka_manager:
    image: "mzagar/kafka-manager-docker:1.3.3.4"
    container_name: kafkamanager
    #configures the kafka manager docker image to run in bridge mode network
    networks:
      - kafkanet
    # Make a port available to services outside of Docker
    ports:
      - 9000:9000
    # It Links kafka_manager container to kafkaserver container to communicate.
    links:
      - kafkaserver:kafkaserver
    environment:
      ZK_HOSTS: "kafkaserver:2181"
Configuring Elasticsearch
Elasticsearch docker-compose simple configuration in the docker-compose.yml something like this
  # Elasticsearch Docker Image
  elasticsearch:
    image: docker.elastic.co/elasticsearch/elasticsearch:6.4.0
    container_name: elasticsearch
    # Make a port available to services outside of Docker
    ports:
      - 9200:9200
      - 9300:9300
    # Configures docker image to run in bridge mode network
    networks:
      - kafkanet
Configuring Kibana
Kibana docker-compose simple configuration in the docker-compose.yml something like this
  # Kibana Docker Image
  kibana:
    image: docker.elastic.co/kibana/kibana:6.4.0
    container_name: kibana
    # Make a port available to services outside of Docker
    ports:
      - 5601:5601
    # It Links kibana container & elasticsearch container to communicate
    links:
      - elasticsearch:elasticsearch
    # Configures docker image to run in bridge mode network
    networks:
      - kafkanet
    # You can control the order of service startup and shutdown with the depends_on option.
    depends_on: ['elasticsearch']
Configuring Logstash
Logstash docker-compose simple configuration in the docker-compose.yml something like this
  # Logstash Docker Image
  logstash:
    image: docker.elastic.co/logstash/logstash:6.4.0
    container_name: logstash
    # It Links elasticsearch container & kafkaserver container  & logstash container to communicate
    links:
      - elasticsearch:elasticsearch
      - kafkaserver:kafkaserver
    # Configures docker image to run in bridge mode network
    networks:
      - kafkanet
    # You can control the order of service startup and shutdown with the depends_on option.
    depends_on: ['elasticsearch', 'kafkaserver']
    # Mount host volumes into docker containers to supply logstash.config file
    volumes:
      - '/private/config-dir:/usr/share/logstash/pipeline/'
Next, we will configure a Logstash pipeline that pulls our logs from a Kafka topic, process these logs and ships them on to Elasticsearch for indexing.
Setup Logstash pipeline
Pipelines are configured in logstash.conf. Below is brief notes on what we are configuring:
- Accept logs from Kafka topics for the configured kafka cluster
- Filter messages and apply transformation rules as per requirement. For this setup, we are converting UTC datetime to a specific timezone when persisted to index.
- Log messages captured from
SIT&UATenvironments are captured to their individual index.
# Plugin Configuration. This input will read events from a Kafka topic.
# Ref Link - https://www.elastic.co/guide/en/logstash/current/plugins-inputs-kafka.html

input {
  kafka {
    bootstrap_servers => "kafkaserver:9092"
    topics => ["sit.catalogue.item","uat.catalogue.item"]
    auto_offset_reset => "earliest"
    decorate_events => true
  }
}

# Filter Plugin. A filter plugin performs intermediary processing on an event.
# Ref Link - https://www.elastic.co/guide/en/logstash/current/filter-plugins.html

filter {
  json {
    source => "message"
  }
  mutate {
    remove_field => [
      "[message]"
    ]
  }
  if (![latency] or [latency]=="") {
    mutate {
      add_field => {
        latency => -1
      }
    }
  }
  date {
    match => [ "time_stamp", "yyyy-MM-dd'T'HH:mm:ss.SSS'Z'" ]
    timezone => "Europe/London"
    target => [ "app_ts" ]
    remove_field => ["time_stamp"]
  }
  if ([@metadata][kafka][topic] == "uat.catalogue.item") {
    mutate {
      add_field => {
        indexPrefix => "uat-catalogue-item"
      }
    }
  }else if ([@metadata][kafka][topic] == "sit.catalogue.item") {
    mutate {
      add_field => {
        indexPrefix => "sit-catalogue-item"
      }
    }
  }else{
    mutate {
      add_field => {
        indexPrefix => "unknown"
      }
    }
  }
}

#An output plugin sends event data to a particular destination. Outputs are the final stage in the event pipeline.
# Ref Link - https://www.elastic.co/guide/en/logstash/current/output-plugins.html
output {
  elasticsearch {
    hosts => ["elasticsearch:9200"]
    index => "%{[indexPrefix]}-logs-%{+YYYY.MM.dd}"
  }
}
Below is detailed explanation of different bits configured in logstash.conf file:
decorate_events: Metadata is only added to the event if the decorate_events option is set to true (it defaults to false).
Please note that @metadata fields are not part of any of your events at output time. If you need these information to be inserted into your original event, you’ll have to use the mutate filter to manually copy the required fields into your event.
decorate_events => truemutate: The mutate filter allows you to perform general mutations on fields. You can rename, remove, replace, and modify fields in your events. Below is example of mutation on json fieldlatency. If the latency is not provided from the source application we can set it to default-1
if (![latency] or [latency]=="") {
  mutate {
    add_field => {
      latency => -1
    }
  }
}
remove_field => message: Logstash output producesmessagefield. Storing this rawmessagefield to elasticsearch is only adding unused or redundant data. so we can removemessagefield using below filter
mutate {
  remove_field => [
    "[message]"
  ]
}
Date Filterplugin: The date filter is used for parsing dates from fields, and then using that date or timestamp as the logstash timestamp for the event.In below example we are usingtime_stampfield from JSON (which is in UTC time formate provided by source application) & converting it to"Europe/London"timezone.
date {
  match => [ "time_stamp", "yyyy-MM-dd'T'HH:mm:ss.SSS'Z'" ]
  timezone => "Europe/London"
  target => [ "app_ts" ]
  remove_field => ["time_stamp"]
}index-prefixfield: We are creating index prefix"uat-catalogue-item"&"sit-catalogue-item"based on the metadata info provided by kaka broker. As creating multiple cluster for POC will be bit heavier. so we are using same cluser to demonstrat two enviroment. we are using below meta field to identify kafka topic for diffrent enviroment.
[@metadata][kafka][topic] : original Kafka topic name from where the message was consumed.
//If message consumed from uat kafka topic add prefix "uat-catalogue-item"
if ([@metadata][kafka][topic] == "uat.catalogue.item") {
  mutate {
    add_field => {
      indexPrefix => "uat-catalogue-item"
    }
  }
}

//If message consumed from sit kafka topic add prefix "sit-catalogue-item"
else if ([@metadata][kafka][topic] == "sit.catalogue.item") {
  mutate {
    add_field => {
      indexPrefix => "sit-catalogue-item"
    }
  }
}

//If message consumed from any other kafka topic add index prefix "unknown"
else{
  mutate {
    add_field => {
      indexPrefix => "unknown"
    }
  }
}
Note: Update volumes in docker-compose.yml
volumes:
  - 'LOCATION_OF_LOG_STASH_CONF_FILE:/usr/share/logstash/pipeline/'
Syntax for LOCATION_OF_LOG_STASH_CONF_FILE varies based on OS.
volumes
- '/private/config-dir:/usr/share/logstash/pipeline/'volumes
- '//C/Users/config-dir:/usr/share/logstash/pipeline/'Bit insights on Docker Networks
Docker networking utilizes already existing Linux Kernel Networking features like iptables, namespaces, bridges etc. With Docker Networking, we can connect various docker images running on same host or across multiple hosts. By default, three network modes are active in Docker.
- Bridge
- Host
- Null
Bridge Network driver provides single host networking capabilities. By default containers connect to Bridge Network. Whenever container starts, it is provided an internal IP address. All the containers connected to the internal bridge can now communicate with one another. But they can’t communicate outside the bridge network.
# Use bridge network for all the container, keeping all the container in same network will simplify the communication between the container.
networks:
  kafkanet:
    driver: bridge
Updating host file
And the final step is to configure the links that are registered between the containers in docker-compose.yml file. As we are setting up everything on the same system, we need to resolve the links to localhost i.e 127.0.0.1
127.0.0.1 kafkaserver
127.0.0.1 elasticsearch
Putting it all together
version: "2"
services:
  # Kafka Server & Zookeeper Docker Image
  kafkaserver:
    image: "spotify/kafka:latest"
    container_name: kafka
    # Configures docker image to run in bridge mode network
    hostname: kafkaserver
    networks:
      - kafkanet
    # Make a port available to services outside of Docker
    ports:
      - 2181:2181
      - 9092:9092
    environment:
      ADVERTISED_HOST: kafkaserver
      ADVERTISED_PORT: 9092

  # Kafka Manager docker image, it is a web based tool for managing Apache Kafka.
  kafka_manager:
    image: "mzagar/kafka-manager-docker:1.3.3.4"
    container_name: kafkamanager
    #configures the kafka manager docker image to run in bridge mode network
    networks:
      - kafkanet
    # Make a port available to services outside of Docker
    ports:
      - 9000:9000
    # It Links kafka_manager container to kafkaserver container to communicate.
    links:
      - kafkaserver:kafkaserver
    environment:
      ZK_HOSTS: "kafkaserver:2181"

  # Elasticsearch Docker Image
  elasticsearch:
    image: docker.elastic.co/elasticsearch/elasticsearch:6.4.0
    container_name: elasticsearch
    # Make a port available to services outside of Docker
    ports:
      - 9200:9200
      - 9300:9300
    # Configures docker image to run in bridge mode network
    networks:
      - kafkanet

  # Kibana Docker Image
  kibana:
    image: docker.elastic.co/kibana/kibana:6.4.0
    container_name: kibana
    # Make a port available to services outside of Docker
    ports:
      - 5601:5601
    # It Links kibana container & elasticsearch container to communicate
    links:
      - elasticsearch:elasticsearch
    # Configures docker image to run in bridge mode network
    networks:
      - kafkanet
    # You can control the order of service startup and shutdown with the depends_on option.
    depends_on: ['elasticsearch']

  # Logstash Docker Image
  logstash:
    image: docker.elastic.co/logstash/logstash:6.4.0
    container_name: logstash
    # It Links elasticsearch container & kafkaserver container  & logstash container to communicate
    links:
      - elasticsearch:elasticsearch
      - kafkaserver:kafkaserver
    # Configures docker image to run in bridge mode network
    networks:
      - kafkanet
    # You can control the order of service startup and shutdown with the depends_on option.
    depends_on: ['elasticsearch', 'kafkaserver']
    # Mount host volumes into docker containers to supply logstash.config file
    volumes:
      - '/private/config-dir:/usr/share/logstash/pipeline/'

# Use bridge network for all the container, keeping all the container in same network will simplify the communication between the container.
networks:
  kafkanet:
    driver: bridge
Launching the services
Once the docker-compose.yml file is ready, open your favorite terminal in the folder which contains it and run:
$ docker-compose up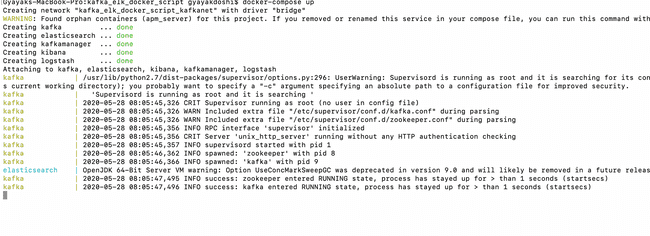
Fire up a new terminal & check status of the containers
$ docker-compose ps
Play around with the provisioned services to configure Centralized Logging Capabilities
- Access
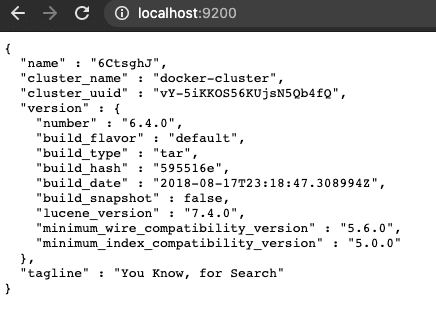
http://localhost:9200/in browser to verify ifElasticsearchis up & running
- Access
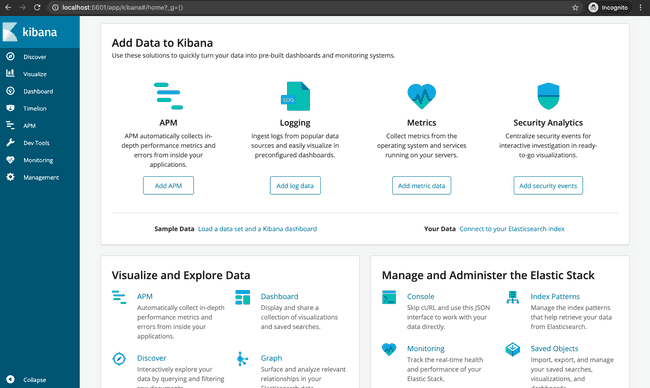
http://localhost:5601/in browser to verify ifKibanais up & running
Access
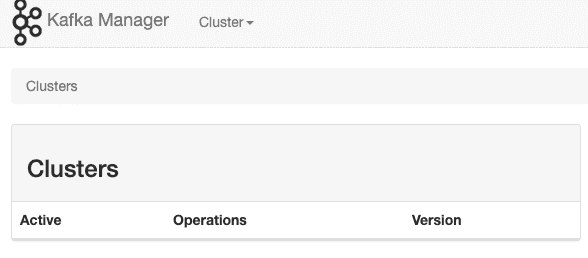
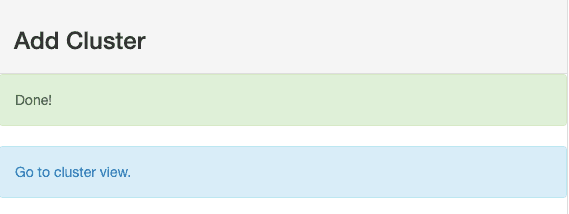
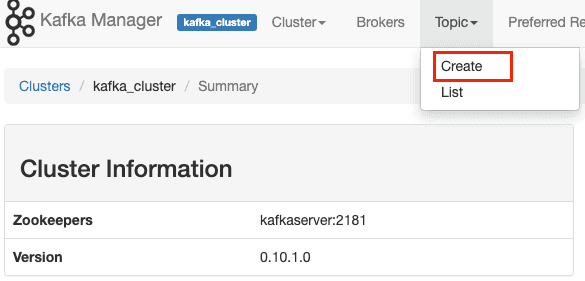
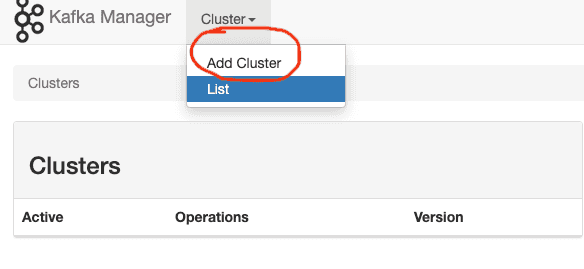
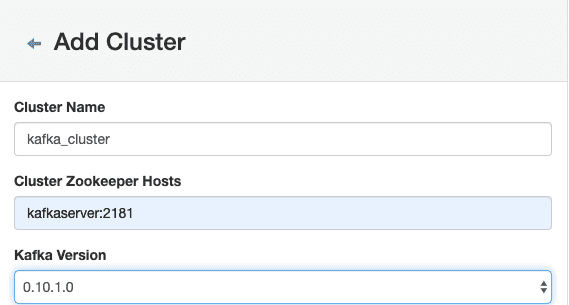
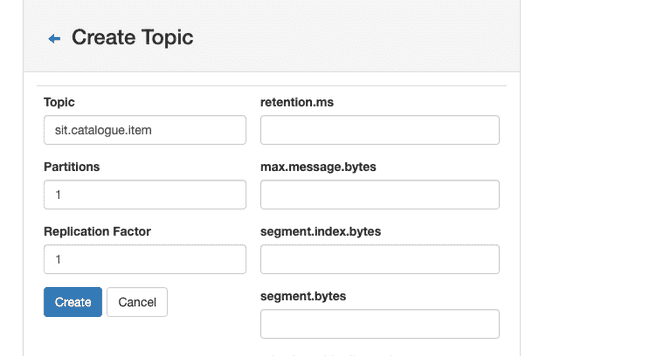
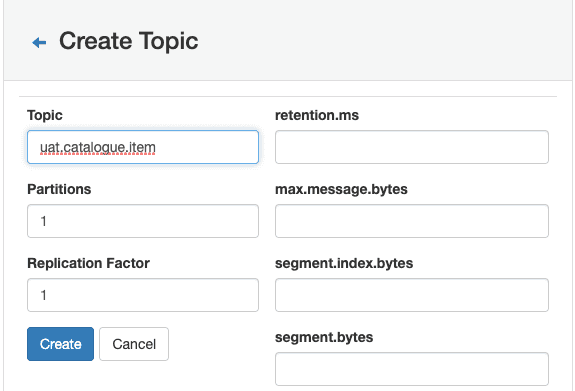
http://localhost:9000in browser to manage Kafka ClusterFollow series of steps to configure the cluster
Publishing log message to kafka topics
It’s time to start preparing messages to be published to Kafka Topics. Log messages can be defined in any format. But if they are in JSON format, we can try to capture many details so that it provides additional capabilities when viewing the entries in Kibana.
Below is the sample log message which we prepared to showcase for this article. As observed, we tried to capture many details that are needed as per the requirement.
{
 # Application Name
"app":"catalogue-item",

# Client Request Id
"crid":"1BFXCD",

#Unique Id
"uuid":"ec25cdc8-a336-11ea-bb37-0242ac130002",

# Message
"msg": {"app":"catalogue-item","crid":"1BFXCD","uuid":"ec25cdc8-a336-11ea-bb37-0242ac130002","msg":"Create Catlogue PayLoad - {'sku':'CTLG-123-0001','name':'The Avengers','description':'Marvel's The Avengers Movie','category':'Movies','price':0,'inventory':0}","status":"SUCCESS","latency":"1","source":"Postman API Client","destination":"Catalogue DataBase","time_stamp":"2020-05-31T13:22:10.120Z"}
,

# Status Code - SUCCESS,ERROR,WARN,INFO
"status":"SUCCESS",

# Time that passes between a user action and the resulting response
"latency":"1",

# Sorce of message
"source":"Postman API Client",

# Destination of message
"destination":"Catalogur Database",

# Application Time Stamp
"time_stamp":"2020-05-31T13:22:10.120Z"
}
Start Kafka producer using the scripts available in the provisioned docker container. Run the below command to start the producer for the provided topic.
$ docker ps

# CONTAINER_NAME - kafka
$ docker exec -it <CONTAINER_NAME> /bin/bash$ cd opt/kafka_2.11-0.10.1.0/bin
$ ./kafka-console-producer.sh --broker-list kafkaserver:9092 --topic uat.catalogue.itemCopy and paste the below messages one by one in the console to publish the messages to the provided topic.
## Message published to `uat.catalogue.item` kafka topic

## SUCCESS Message
{"app":"catalogue-item","crid":"1BFXCD","uuid":"ec25cdc8-a336-11ea-bb37-0242ac130002","msg":"Create Catlogue PayLoad - {'sku':'CTLG-123-0001','name':'The Avengers','description':'Marvel's The Avengers Movie','category':'Movies','price':0,'inventory':0}","status":"SUCCESS","latency":"1","source":"Postman API Client","destination":"Catalogue DataBase","time_stamp":"2020-05-31T13:22:10.120Z"}

## WARN Message
{"app":"catalogue-item","crid":"1BFXCD","uuid":"ec25cdc8-a336-11ea-bb37-0242ac130002","msg":"Create Catlogue PayLoad - {'sku':'CTLG-123-0001','name':'The Avengers','description':'Marvel's The Avengers Movie','category':'Movies','price':0,'inventory':0}","status":"WARN","latency":"1","source":"Postman API Client","destination":"Catalogue DataBase","time_stamp":"2020-05-31T13:22:10.120Z"}

## ERROR Message
{"app":"catalogue-item","crid":"1BFXCD","uuid":"ec25cdc8-a336-11ea-bb37-0242ac130002","msg":"Create Catlogue PayLoad - {'sku':'CTLG-123-0001','name':'The Avengers','description':'Marvel's The Avengers Movie','category':'Movies','price':0,'inventory':0}","status":"ERROR","latency":"1","source":"Postman API Client","destination":"Catalogue DataBase","time_stamp":"2020-05-31T13:22:10.120Z"}
Configuring Kibana
- Access
http://localhost:5601/in browser to popupKibana UIand follow the below series of steps to createIndexand startVisualizingmessages that are pushed to Kafka Topic. - Click
Managementon side navigation bar. - Click on
Index Patterns
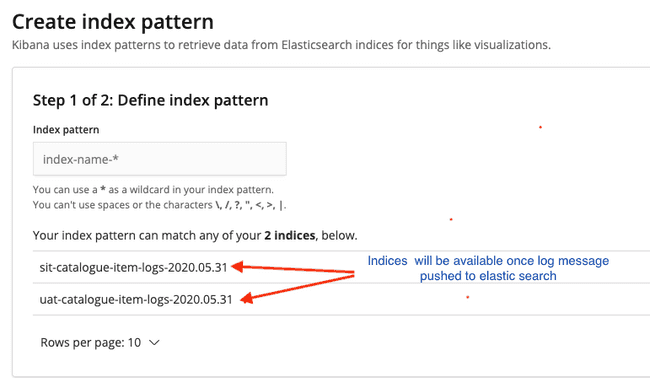
- It will navigate to blow Screen
- Create index pattern for
sitlogs
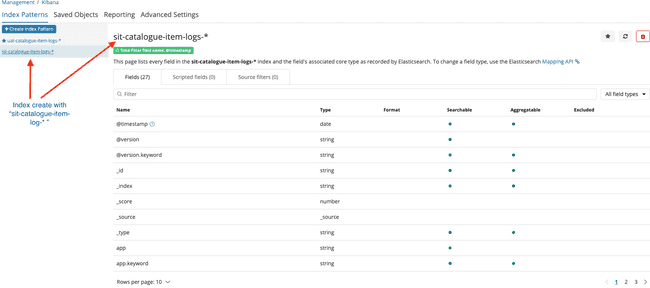
- Configure Settings
- If Index created sucessfully will navigate to blow screen
Click
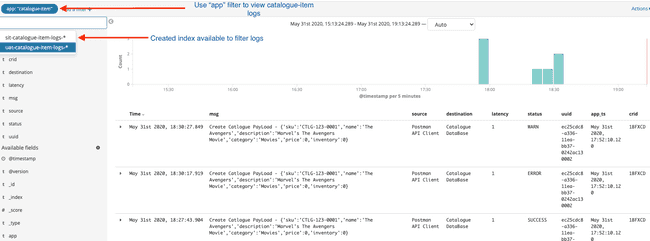
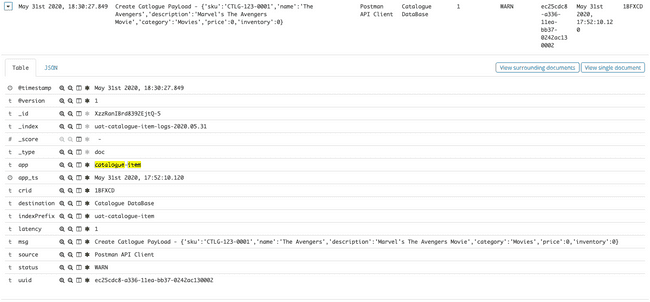
Discoveron side navigation barLogs available in kibana with the index created
- Visualize Message in tabular format
Conclusion
If you had made up to this point 😄 congratulations !!! You have successfully dockerizing the ELK stack with Kafka.
Some useful commands for reference
Docker Commands
# Builds, (re)creates, starts, and attaches to containers for a service
$ docker-compose up

# Stops containers and removes containers, networks, volumes, and images created by up
$ docker-compose down

# Lists all running containers in docker engine
$ docker ps

# List docker images
$ docker images ls

# List all docker networks
$ docker network ls
Kafka Commands
Producers
You can produce messages from standard input as follows:
$ ./kafka-console-producer.sh --broker-list kafkaserver:9092 --topic uat.catalogue.itemConsumers
You can begin a consumer from the beginning of the log as follows:
$ ./kafka-console-consumer.sh --bootstrap-server kafkaserver:9092 --topic uat.catalogue.item --from-beginningYou can consume a single message as follows:
$ ./kafka-console-consumer.sh --bootstrap-server kafkaserver:9092 --topic uat.catalogue.item --max-messages 1You can consume and specify a consumer group as follows:
$ ./kafka-console-consumer.sh --topic uat.catalogue.item --new-consumer --bootstrap-server kafkaserver:9092 --consumer-property group.id=elk-group- https://www.elastic.co/guide/en/logstash/current/plugins-inputs-kafka.html
- https://medium.com/@caysever/docker-compose-network-b86e424fad82
- https://zablo.net/blog/post/setup-apache-kafka-in-docker-on-windows/
- https://medium.com/@marcelo.hossomi/running-kafka-in-docker-machine-64d1501d6f0b
- https://www.elastic.co/guide/en/logstash/current/output-plugins.html
- https://www.elastic.co/guide/en/logstash/current/output-plugins.html
- https://www.elastic.co/guide/en/logstash/current/filter-plugins.html
- https://www.elastic.co/guide/en/logstash/current/plugins-inputs-kafka.html
- https://github.com/lensesio/kafka-cheat-sheet/blob/master/README.md
- https://www.elastic.co/guide/en/logstash/current/plugins-filters-mutate.html
